find your solution.
search for solutions by category, industries, insights, and people.
search for solutions by category, industries, insights, and people.
search for solutions by category, industries, insights, and people.

Accounting Today
Accounting Today
Southeast’s fastest growing hubs as well as Bengaluru, India
.jpg)

For construction contractors pursuing U.S. Department of Defense (DoD) work, cybersecurity has become a direct factor in bid viability. Beyond traditional safety, bonding, and performance requirements, the DoD now expects contractors to demonstrate verified cybersecurity controls as a condition of contract award.
That expectation is formalized through the Cybersecurity Maturity Model Certification (CMMC) program, which embeds cybersecurity directly into DoD contracts for companies that design, build, repair, or maintain defense facilities and infrastructure. Rather than relying on policy statements or self attestations, the program ties validated security practices to eligibility for both prime and subcontract work.
With phased implementation already underway, CMMC is rolling into new and existing contracts. For construction contractors, cybersecurity readiness now influences bidding strategy, teaming arrangements, and continued participation in the defense construction market.
For a broader overview of CMMC requirements and certification levels, see Understanding CMMC: What Defense Contractors Need to Know.
CMMC applies to both prime contractors and subcontractors across the Defense Industrial Base (DIB), including construction firms. Even when cybersecurity is not a contractor’s core business, construction projects often involve access to Federal Contract Information (FCI) or Controlled Unclassified Information (CUI).
Examples include:
When this information resides on contractor-managed systems or third-party platforms, CMMC requirements apply.
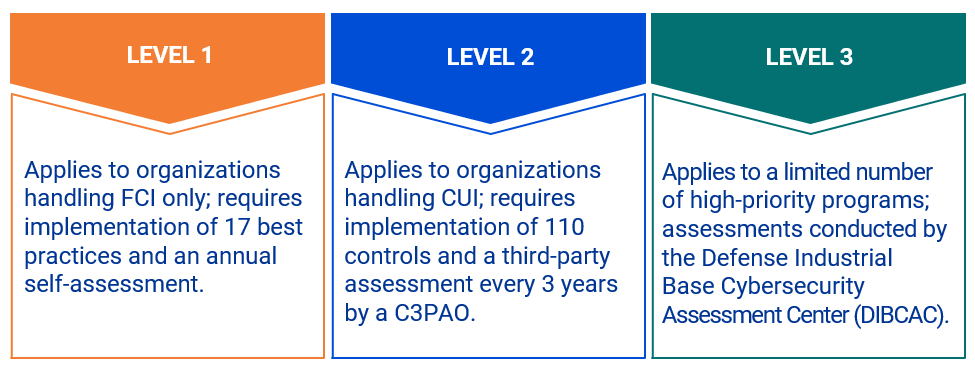
CMMC is a DoD-mandated cybersecurity assessment and certification program that verifies whether contractors have implemented required safeguards for FCI and CUI. Unlike prior models that relied largely on contractor representations, CMMC ties verified cybersecurity practices directly to contract eligibility.
The framework aligns existing requirements into a single enforceable standard across the defense supply chain.
Most DoD construction contractors will encounter either Level 1 or Level 2 requirements.
CMMC requirements are now being incorporated into DoD contracts and have become a condition of contract award. Failure to meet the required CMMC level can result in loss of eligibility to bid or participate in defense contracts, including as a subcontractor.
Phased implementation is now underway. CMMC requirements are now appearing in solicitations and contracts, marking the transition from policy guidance to active enforcement.
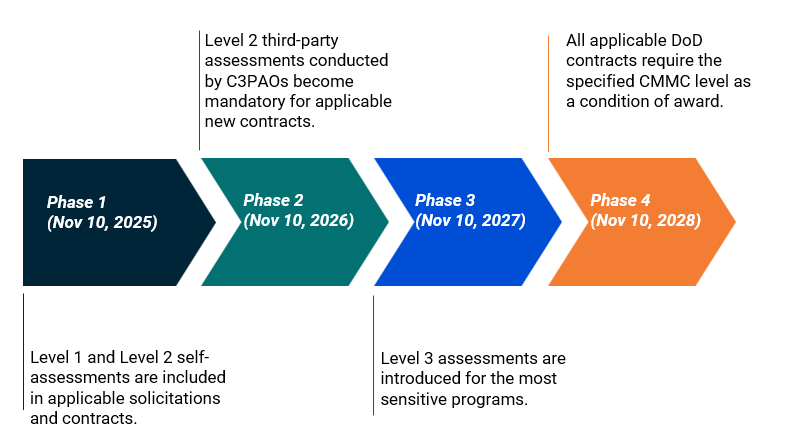
For construction contractors, these milestones often overlaps with long bid and award cycles, multi year project timelines, and layered subcontractor relationships. As a result, CMMC compliance affects not only IT systems, but also project planning, teaming strategies, and risk management decisions across the life of a contract.
CMMC readiness helps construction firms understand how cybersecurity requirements apply to their operations before certification becomes mandatory.
At Elliott Davis, a CMMC Readiness Assessment is performed by a coordinated team that understands construction operations, project workflows, and DoD expectations. Readiness efforts focus on:
For construction contractors, readiness often clarifies where cybersecurity responsibilities sit across field operations, corporate systems, and third party platforms.
CMMC reflects a broader shift in how the DoD manages risk across its supply chain. Cybersecurity is now treated as a prerequisite for participation, not an administrative afterthought.
Construction contractors that address readiness early are better positioned to respond to solicitations, support prime contractor requirements, and maintain continuity across active and future projects.
Elliott Davis works with construction contractors in the DoD pipeline to support CMMC readiness through scoping, gap assessments, and planning support. Our focus is helping firms understand how CMMC applies to their operations and what steps support contract access as requirements continue to roll into DoD construction work.
Contact us today to start the conversation.
The information provided in this communication is of a general nature and should not be considered professional advice. You should not act upon the information provided without obtaining specific professional advice. The information above is subject to change.

If you own a small business or invest in one, the recent changes to the Qualified Small Business Stock (QSBS) exclusion under IRC §1202 could dramatically impact your tax strategy, exit planning, and investment structure.
Whether you're a founder planning a liquidity event, an early-stage investor looking for tax-efficient returns, or a growing company evaluating entity structure, these updates offer powerful new opportunities to reduce capital gains taxes and maximize after-tax wealth.
The IRC §1202 QSBS exclusion allows eligible shareholders to exclude a portion, or even all, of their capital gains from federal tax when selling stock in a qualified small business. Historically, this exclusion required a five-year holding period and applied only to C corporations with gross assets of no more than $50 million.
Recent legislative updates under the One Big Beautiful Bill Act (OBBBA) have significantly expanded the scope and impact of QSBS tax benefits. Here’s what changed:
For QSBS acquired after July 4, 2025, investors can now benefit from a tiered exclusion:
Translation: You no longer have to wait five years to enjoy tax benefits as earlier exits are now available.
Note: The gain cap is now the greater of $15 million or 10 times the aggregate adjusted basis of the QSBS issued by the corporation.
Interplay: Immediate expensing under §§ 174 and 174A may help companies stay under the threshold even after raising substantial capital.
These changes offer a unique opportunity for small business owners and investors to rethink how they structure ownership, plan exits, and design equity incentives. Below are some of the most compelling ways to leverage the enhanced QSBS framework for tax efficiency and strategic growth.
No. QSBS only applies to C corporations. However, converting your entity or restructuring existing business units/assets may unlock eligibility.
Yes. Under the new rules, you can get 50% or 75% exclusions at years 3 and 4.
Once the cap is reached for a given issuer, no further exclusions apply for that issuer in future years.
At Elliott Davis, we specialize in helping businesses capitalize on QSBS opportunities. Our services include:
Ready to explore how QSBS can enhance your strategy? Contact us today to start the conversation.

Edit: Originally published on September 13, 2023. Updated to reflect recent developments.
The outcome of the 2018 Supreme Court decision in South Dakota V. Wayfair brought the discussion of nexus and nexus creating activities to the forefront for all businesses that operate under a remote business structure. By introducing the “economic presence” standard, the ability of state and local governments to impose tax obligations on business entities drastically increased while creating a more complex tax atmosphere.
Nearly every state with a sales tax has now enacted some kind of legislation on marketplace facilitators. These laws have eased certain sales tax collection responsibilities for remote sellers, but they have not eliminated risk. Definitions, exemptions, and reporting requirements continue to vary widely by state, and gaps between marketplace compliance and seller compliance remain common.
As economic nexus laws expanded, states adopted marketplace facilitator laws that generally place sales and use tax collection responsibility on the marketplace rather than the seller. While statutory definitions differ, most states define a marketplace facilitator as a business that performs the following activities:
While marketplace tax laws have provided taxpayers with some relief on the sales tax front, they do not entirely remove the challenges a remote seller may face. Most notably, inventory stored in a marketplace facilitator’s warehouse can result in a physical presence within the state, even when a taxpayer is not aware their goods are being held there. As pre-Wayfair legislation indicates, a physical presence establishes nexus and therefore can carry certain tax obligations with it, including income and/or franchise tax filing requirements.
This can create income and franchise tax filing requirements. Taxpayers may be required to file an income tax return in states where they would otherwise be eligible for protection from state income taxes. Although P.L. 86-272 may have applied previously, inventory-based nexus may now exceed that protection, depending on the state and the specific facts and circumstances.
Another significant development is the enhanced enforcement efforts that have resulted from technological advancements within the state revenue agencies over the past few years. As states continue to modernize audit tools and data sharing capabilities, marketplace data is more readily available to tax authorities. This has led to increased scrutiny of remote sellers whose filings, or lack thereof, do not align with marketplace activity.
Since nexus laws vary by state, there may never be a consensus about how third-party marketplace facilitator inventory impacts remote sellers’ state filing obligations. This lack of consistency will likely increase confusion and decrease compliance. However, recent rulings do provide some insight into how states are applying these rules in practice.
Recent developments highlight a broader trend toward stricter interpretations of marketplace inventory as a nexus-creating activity:
• South Carolina: Between 2024 and 2026, South Carolina courts confirmed Amazon’s sales tax liability for third-party marketplace sales in 2016, affirming that marketplace facilitators were treated as retailers before Wayfair and upholding a $12.49 million assessment for uncollected first-quarter sales tax.
• California: California Office of Tax Appeals (OTA) holds that out-of-state businesses using Amazon’s Fulfillment by Amazon (FBA) program for inventory storage establishes nexus in California for sales, franchise, and income tax, regardless of bright line economic thresholds.
• Broader state trends: Numerous states have revised nexus thresholds and expanded marketplace facilitator enforcement, often applying a more aggressive view of inventory-based nexus.
• Does selling through a marketplace eliminate my sales tax obligations? No. In most states, marketplace facilitator laws place responsibility for collecting and remitting sales tax on the platform for marketplace transactions. However, sellers may still have obligations related to direct sales, registration, or reporting.
• Do marketplace sales still count toward my sales tax or income tax nexus? Yes. Marketplace sales can still count toward nexus thresholds and create filing obligations, particularly in states where sellers have both marketplace and direct sales activity.
• Can marketplace inventory create income tax nexus? Yes. Generally, inventory stored in a marketplace facilitator’s warehouse can create physical presence nexus, even if the seller does not control or know the inventory’s location.
• What should a seller do if they are unaware of where their inventory is stored? Best practice is to review inventory logs provided by the marketplace facilitator and reconcile them with internal records. When these reports are not reviewed, sellers are often caught off guard by unexpected nexus exposure.
• Can a business be held liable even if it didn’t know its inventory was stored in the state? Yes. Lack of awareness does not eliminate nexus or related filing obligations.
• Does marketplace facilitator legislation eliminate the seller’s responsibility to collect and remit sales tax entirely? Not necessarily. Sellers remain liable for collecting and remitting sales tax on direct-to-consumer sales made outside the marketplace and may still have income and franchise tax obligations.
• How can sellers better manage this risk? Best practices include tracking marketplace inventory locations, reconciling marketplace reports to state filings, and periodically reviewing nexus assumptions.
Businesses operating through online marketplaces should periodically reassess their nexus profile, filing positions, and assumptions about compliance. Proactive review before a notice or audit can help identify exposure, reduce penalties, and support defensible positions across jurisdictions.
If you are unsure how these laws and business practices may affect you and would like to better understand your nexus footprint and overall tax obligations, reach out to our team to start the conversation.
The information provided in this communication is of a general nature and should not be considered professional advice. You should not act upon the information provided without obtaining specific professional advice. The information above is subject to change.


